From TradingView · · 50s
USD/GBP Bearish Market Structure
USD/GBP shows bearish market structure with liquidity sweep targeting 0.7433 and 0.7386.
In brief
USD/GBP shows bearish market structure with liquidity sweep targeting 0.7433 and 0.7386. USD/GBP forms lower highs and lower lows after buy-side liquidity sweep near 0.7580-0.7590. Originally reported by TradingView.
Market Structure Analysis
Price transitioned from bullish trend to bearish structure after forming higher highs and higher lows.
“Bullish phase (late August to early October) Price formed higher highs (HH) and higher lows (HL)”
Liquidity Sweep Zones
Buy-side liquidity near 0.7580-0.7595 followed by bearish rejection and price drop.
“Buy-side liquidity commonly rests above previous swing highs, where breakout buyers may place orders”
Sell-Side Liquidity Areas
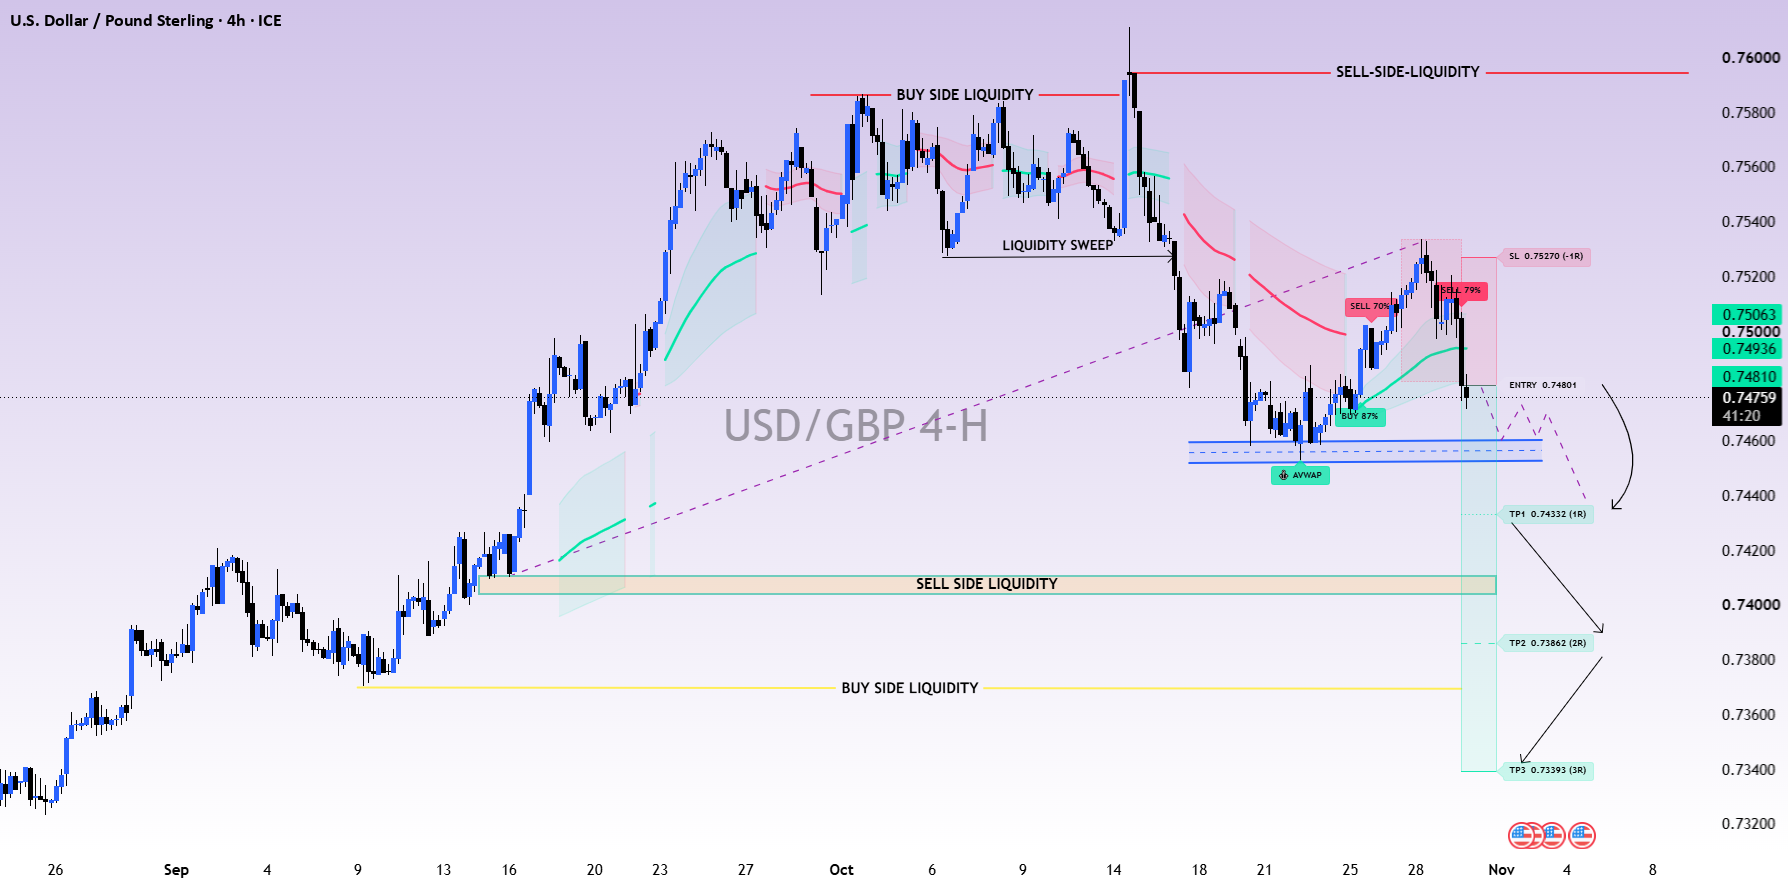
Near-term liquidity at 0.7450-0.7460 with deeper zones around 0.7400-0.7410 and 0.7370.
“Near-term liquidity 0.7450-0.7460 Recent lows beneath the consolidation”
Supply and Demand Zones
Resistance near 0.7515-0.7530 and support at 0.7450-0.7460 with potential liquidity targets.
“Supply zone, potential bearish reaction Approximate zone: 0.7515-0.7530”
Bearish Setup Scenario
Price fails to reclaim 0.7515-0.7530 resistance before breaking 0.7450-0.7460 support.
“Potential bearish sequence: Price fails to reclaim the 0.7515-0.7530 resistance zone”
Key Targets and Invalidation
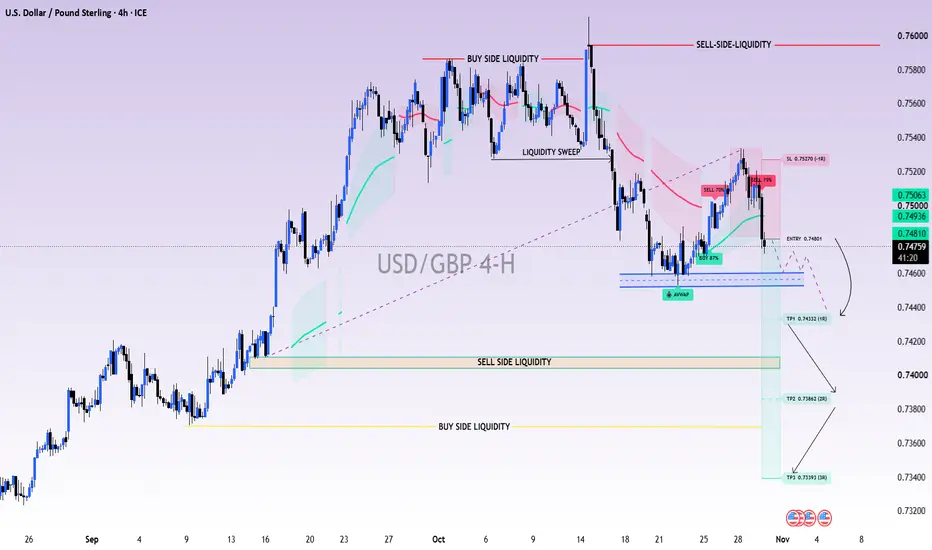
Downside targets at 0.7433 and 0.7386 with invalidation above 0.7530.
“Marked entry 0.74801 Marked stop-loss 0.75270 TP1 0.74332 TP2 0.73862 TP3 0.73393”
The headline
USD/GBP forms lower highs and lower lows after buy-side liquidity sweep near 0.7580-0.7590.