From TradingView · · 2m
VANA at a crossroads: breakout or breakdown?
VANA/USDT is testing a descending trendline that has defined its downtrend since early 2025. What happens next will determine whether the bearish structure breaks or holds.
In brief
VANA/USDT is testing a descending trendline that has defined its downtrend since early 2025. What happens next will determine whether the bearish structure breaks or holds. Watch whether VANA closes above its descending trendline on the 4-day chart. A confirmed breakout with retest could signal the end of the…
VANA trapped in downtrend since early 2025
VANA/USDT shows a clear long-term downtrend with lower highs connected by a descending trendline. Price currently sits around 0.90 USDT with a visible low near 0.815 USDT.
Bearish pressure dominates while price stays below trendline
As long as VANA remains below the descending trendline, sellers maintain structural control. But as price approaches the end of this pattern, a critical decision point is forming.
Support at 0.815 USDT is make or break
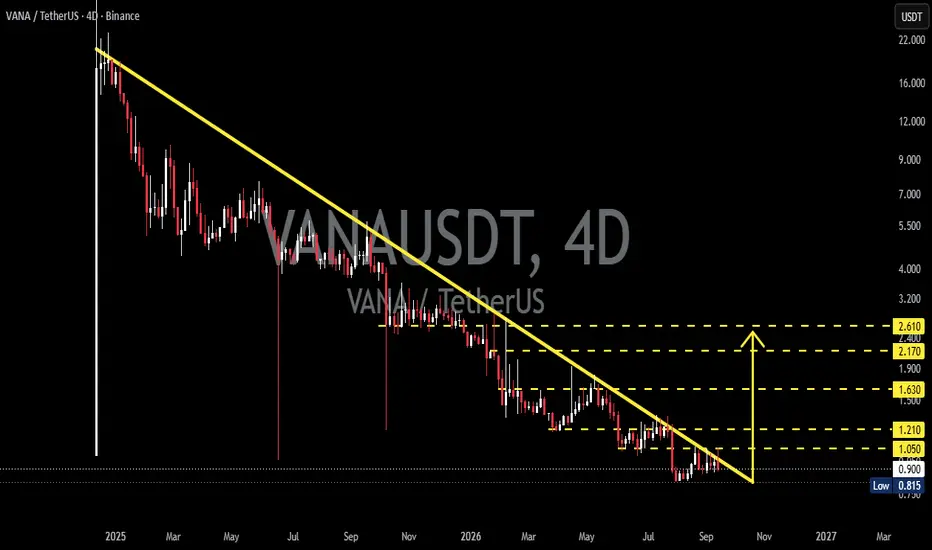
The 0.815 USDT level marks an important low. If it holds, VANA could form a higher low and enter an accumulation phase. A break below it signals the bearish structure remains intact.
Bullish case: breakout with strong confirmation
A successful breakout requires a 4-day candle close above the trendline, followed by a retest that holds as support. This would signal weakening bearish pressure and open targets at 1.05, 1.21, 1.63, 2.17, and 2.61 USDT.
“A 4D candle close above the trendline followed by a successful retest would provide stronger structural confirmation.”
Resistance levels to watch on the upside
If the bullish breakout plays out, VANA faces five resistance zones: 1.05, 1.21, 1.63, 2.17, and 2.61 USDT. The 1.63 to 2.61 zone becomes critical if momentum sustains through each level.
Bearish case: rejection keeps downtrend alive
If price gets rejected at the trendline again, sellers regain control. Loss of 1.05 USDT support could trigger a retest of 0.90 USDT, with 0.815 USDT as the final critical level.
Why 4-day candle close matters more than wicks
On the 4-day timeframe, a wick above the trendline doesn't confirm a breakout. Only a full candle close above the line followed by a successful retest provides true structural confirmation.
VANA at a critical inflection point
VANA is now in a key zone where price's reaction to the descending trendline will determine the next major move. Both bullish and bearish scenarios remain valid until confirmation arrives.
“VANA is currently in an interesting area to monitor as price approaches the key dynamic resistance.”
At a glance
Watch whether VANA closes above its descending trendline on the 4-day chart. A confirmed breakout with retest could signal the end of the downtrend, while rejection would keep bears in control.