From TradingView · · 40s
Wipro Daily Chart Shows Falling Resistance
Wipro's daily chart shows falling resistance with 3 touches before a potential break.
In brief
Wipro's daily chart shows falling resistance with 3 touches before a potential break. Wipro's daily chart shows falling resistance with 3 touches before a potential break. Originally reported by TradingView.
Wipro Daily Chart
Wipro on the daily chart shows a falling resistance line with 3 touches from 11 Feb 26 to 19 Oct 26.
Resistance Line Status
Newest closed candle on 19 Oct 26 closed right at the resistance line with no candles closing above it.
Our View
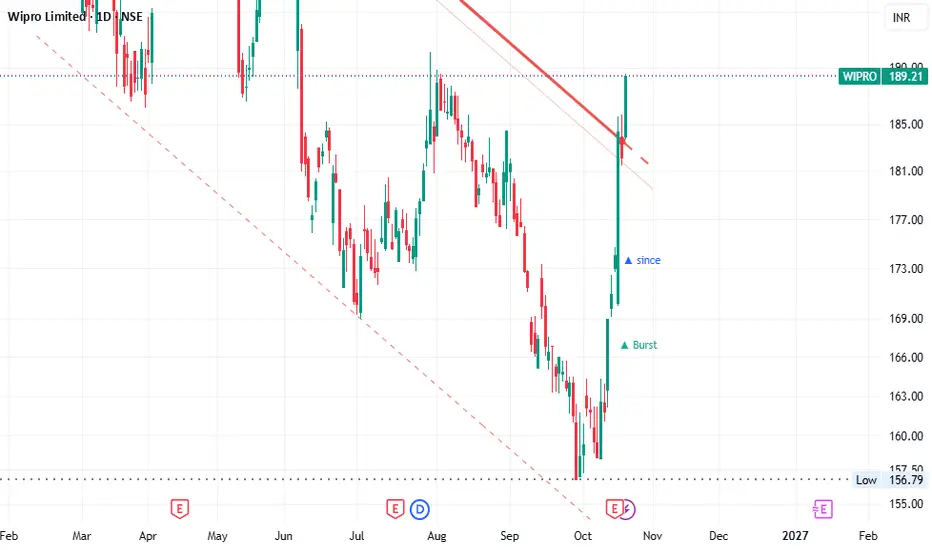
As long as daily candles close below the resistance line and the pivot high of 19 Oct 26 isn't broken, the structure stays intact with downward bias.
What matters most
Wipro's daily chart shows falling resistance with 3 touches before a potential break.