From TradingView · · 1m
ZAMA Accumulation Before Next Breakout
ZAMA price could break above $0.080, $0.082 resistance, signaling bullish continuation.
In brief
ZAMA price could break above $0.080, $0.082 resistance, signaling bullish continuation. ZAMA/USDT may break above $0.080, $0.082 resistance to target $0.09228 if bullish momentum holds. Originally reported by TradingView.
ZAMA Consolidation Pattern
ZAMA/USDT is consolidating inside a descending channel after a strong bullish impulse toward $0.10.
Flagpole: Bullish Impulse
September's sharp upward rally shows strong buying momentum before consolidation.
Flag Consolidation
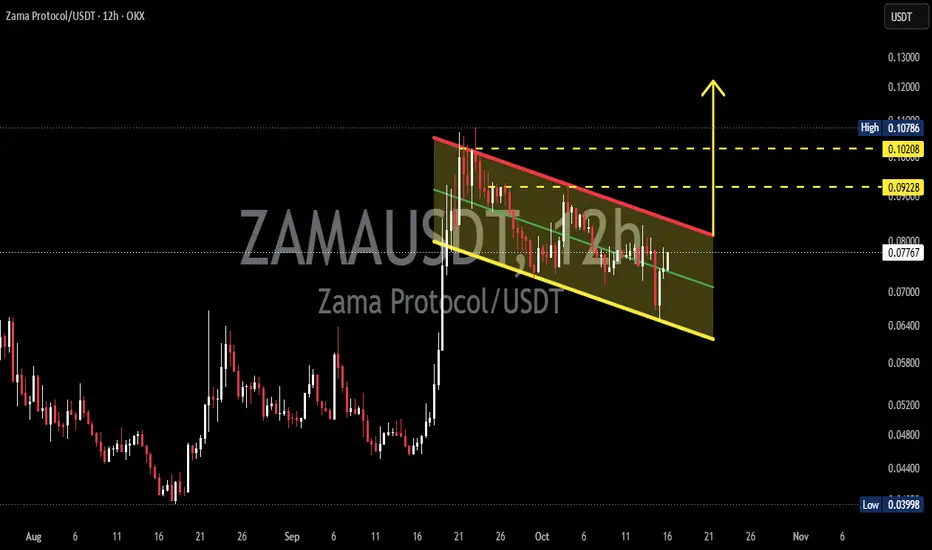
Price forms lower highs and lower lows within a descending channel bounded by red resistance and yellow support.
Bullish Scenario
Breakout above $0.080, $0.082 resistance could target $0.09228, $0.10208, and $0.10786.
Bearish Scenario
Failure to break resistance could trigger a breakdown toward $0.075, $0.077 support.
Key Levels to Watch
Bullish trigger: $0.080, $0.082 resistance; bearish warning: loss of $0.075, $0.077 support.
Market Outlook
ZAMA trades around $0.07722 with potential for $0.09228 target if buyers hold resistance.
Trading Perspective
Confirm breakout before entering longs; define stop-loss to avoid chasing.
What matters most
ZAMA/USDT may break above $0.080, $0.082 resistance to target $0.09228 if bullish momentum holds.