From TradingView · · 1m 20s
Bitcoin Recovery Faces Resistance
Bitcoin's short-term rebound hits key resistance levels as bearish trendline holds.
In brief
Bitcoin's short-term rebound hits key resistance levels as bearish trendline holds. Bitcoin's 1-hour chart shows recovery near 82,957 but faces resistance at 83,300-83,400 with bearish trendline intact. Originally reported by TradingView.
Market Overview
Bitcoin shows short-term recovery on 1-hour chart trading near 82,957 after rebounding from lower support.
Dynamic Bearish Trendline
Descending trendline connects swing highs and remains key overhead resistance reference.
Key Resistance Zone
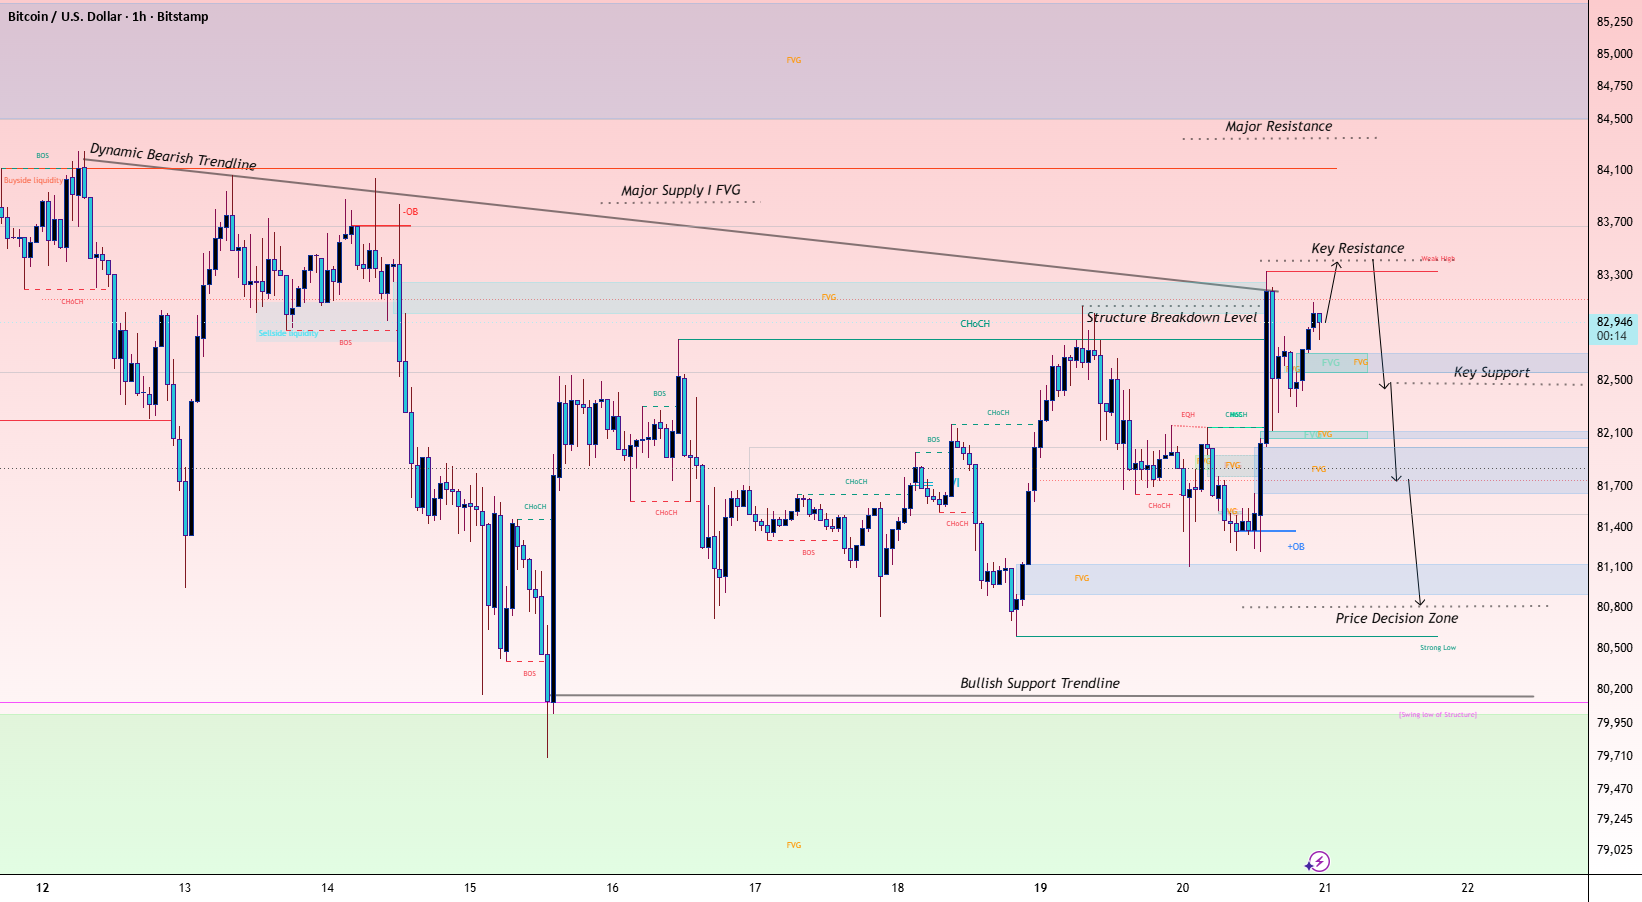
Price faces resistance around 83,300-83,400 with broader supply area extending toward 84,100.
Buy-Side Liquidity
Recent swing highs near upper resistance contain clustered stop orders attracting price.
Key Support Level
Nearby support around 82,500 with fair value gaps below current price.
Structure Breakdown Level
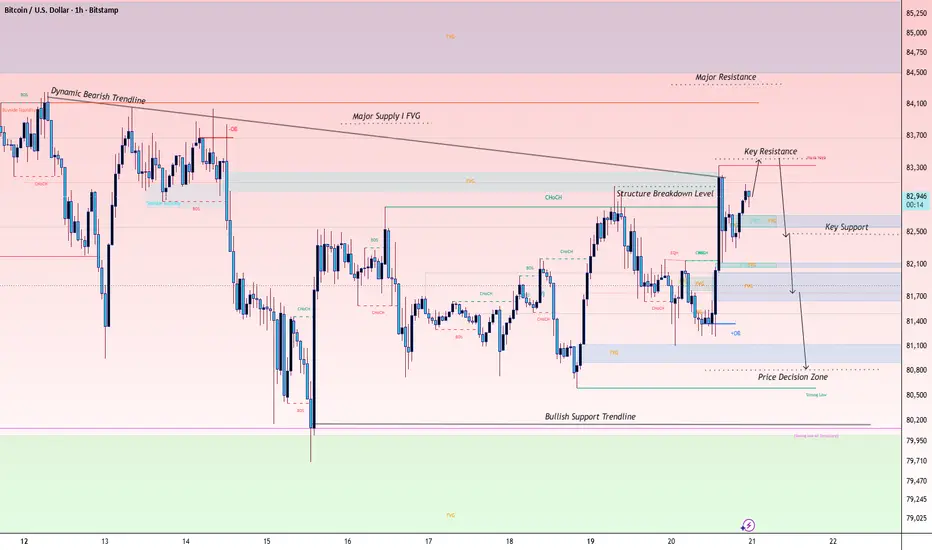
Price must hold above structure to maintain short-term bullish recovery strength.
Price Decision Zone
Lower price decision region around 80,800-81,000 provides downside reference areas.
Bullish Scenario
Price must hold support, form higher low, break resistance, and retest for bullish continuation.
Bearish Scenario
Clear rejection from resistance, bearish market structure shift, and break below support confirm bearish move.
Risk Management
Position sizing, stop-loss placement, and risk-to-reward must be determined before entry.
Conclusion
Bitcoin's recovery faces resistance with bearish trendline intact; confirmed breakout needed for bullish reversal.
What matters most
Bitcoin's 1-hour chart shows recovery near 82,957 but faces resistance at 83,300-83,400 with bearish trendline intact.