From TradingView · · 1m
Dow Jones 30 Rises to Test Resistance
Dow Jones Industrial Average climbs moderately as it tests key resistance level for potential upside.
In brief
Dow Jones Industrial Average climbs moderately as it tests key resistance level for potential upside. Dow Jones Industrial Average rises moderately to test 52,749 resistance level, signaling potential for further gains if resistance is broken. Originally reported by TradingView.
Market Structure Shift
Dow Jones Industrial Average shows shift from bearish to bullish character after September decline.
Bullish Change of Character
Price initiated impulsive rise from 50,800, 51,000 zone between October 9 and 13.
Bullish Break of Structure
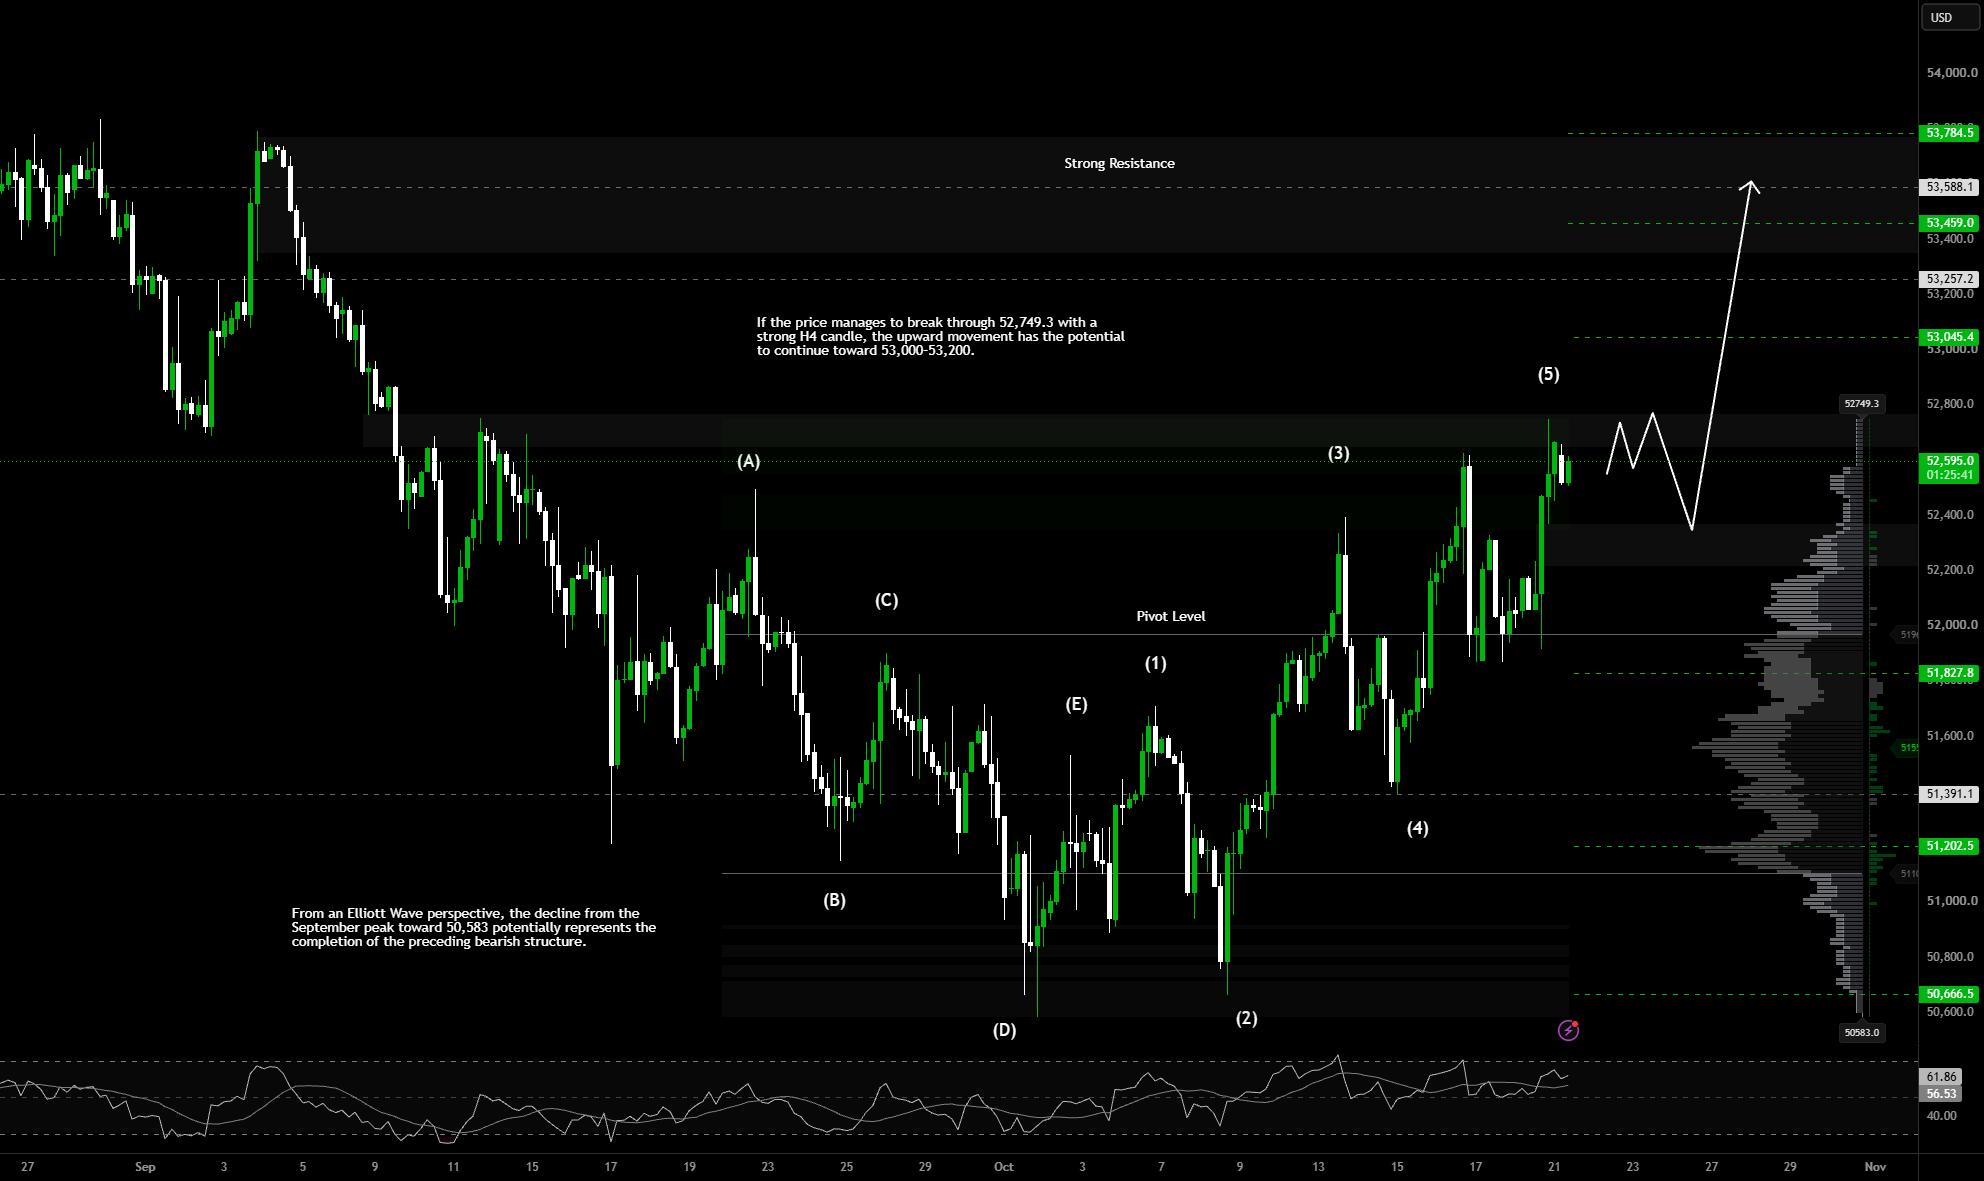
Price cleared 51,950, 52,000 resistance zone, confirming initial bullish structure.
Resistance Test
Price hovers around 52,606, just below 52,749 resistance level for potential profit-taking.
Elliott Wave Analysis
Decline from September peak to 50,583 may complete bearish structure, with rise as new bullish impulse.
Bullish Wave 5 Projection
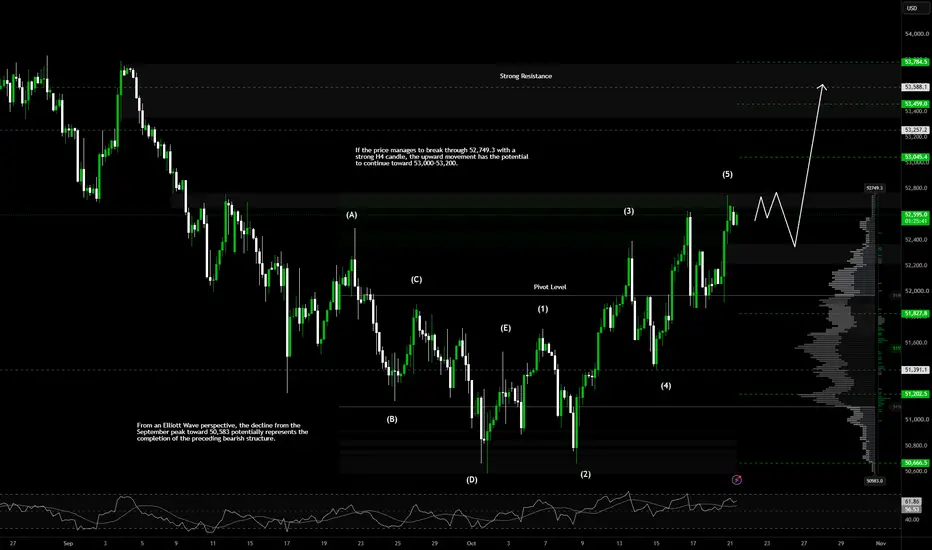
Price breaking above 52,749 could push toward 53,000, 53,200 if strong H4 candle confirms.
RSI Momentum Confirmation
RSI (14) at 62.09 shows bullish momentum, but price reaction at 52,749 remains critical for confirmation.
The big picture
Dow Jones Industrial Average rises moderately to test 52,749 resistance level, signaling potential for further gains if resistance is broken.


