From TradingView · · 30s
Nifty IT Breakout Pattern
Nifty IT index breaks ceiling on TradingView chart.
In brief
Nifty IT index breaks ceiling on TradingView chart. Nifty IT index closed above a horizontal breakout ceiling on 16 Oct 2026. Originally reported by TradingView.
Nifty IT Horizontal Breakout
Nifty IT index shows a horizontal breakout pattern on TradingView chart.
Breakout Ceiling Pattern
The pattern has a flat ceiling where the line turned down twice and closed above it.
Recent Breakout Confirmation
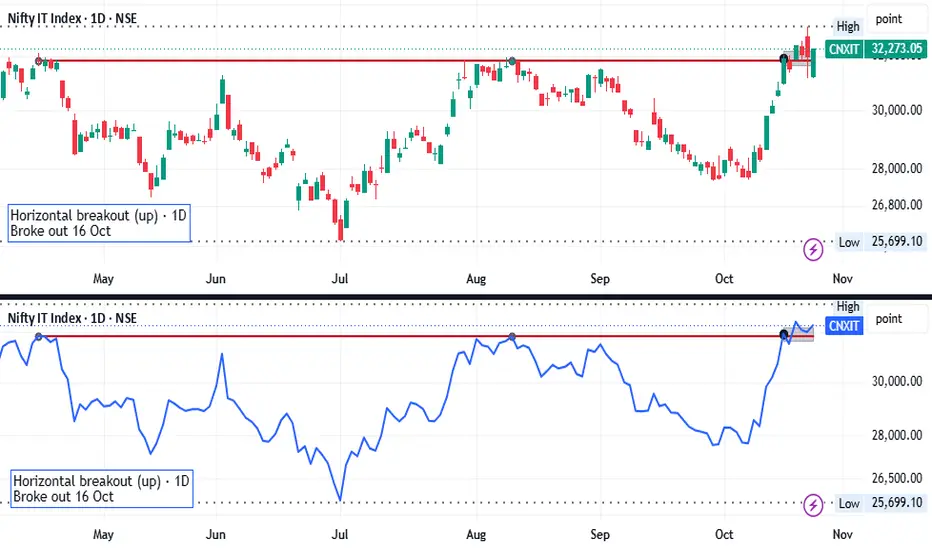
The newest closed candle on 26 Oct 2026 is above the ceiling pattern.
The big picture
Nifty IT index closed above a horizontal breakout ceiling on 16 Oct 2026.