From TradingView · · 1m 20s
S&P 500 charts suggest rally ahead of FOMC decision
Technical analysis indicates the market correction may be incomplete, with potential for a sharp move higher before the September rate decision.
In brief
Technical analysis indicates the market correction may be incomplete, with potential for a sharp move higher before the September rate decision. Despite widespread expectations for a rate hike and market correction, chart patterns suggest the S&P 500 has one more leg up to around 8050-8100 before any sustained…
Market expects rate hike and correction
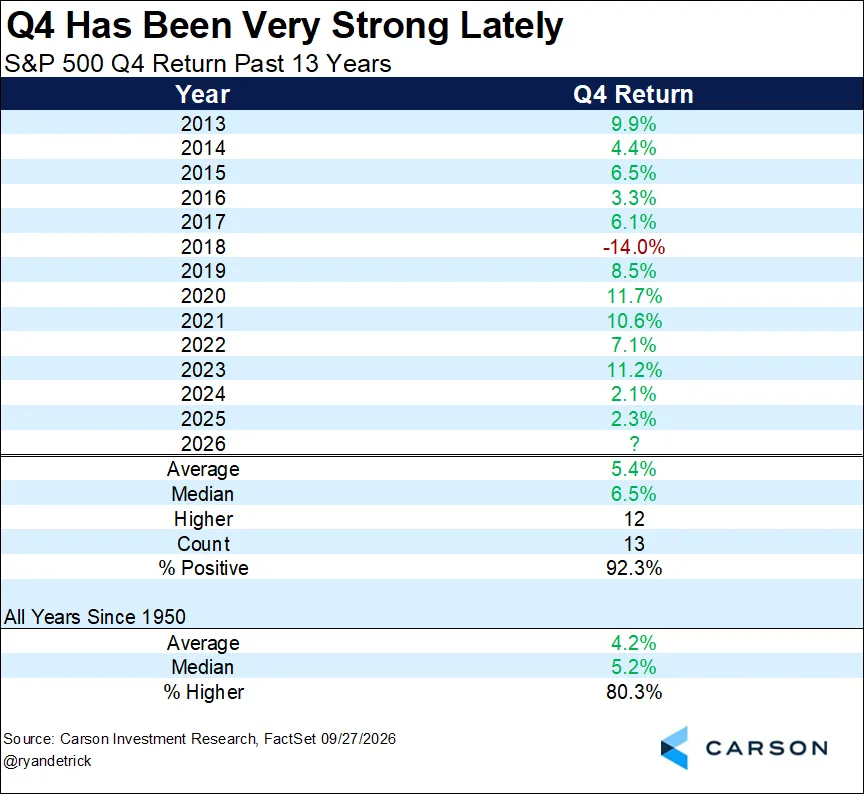
The broader market is bracing for a Federal Reserve rate increase decision in September 2026 and anticipating a market correction that could extend into October.
But charts tell a different story
The S&P 500 has fallen from 7810 to 7580, but the pattern doesn't match a typical market correction. The bull rally appears incomplete rather than exhausted.
“the charts have started telling a different story”
Elliott wave points to one more leg up
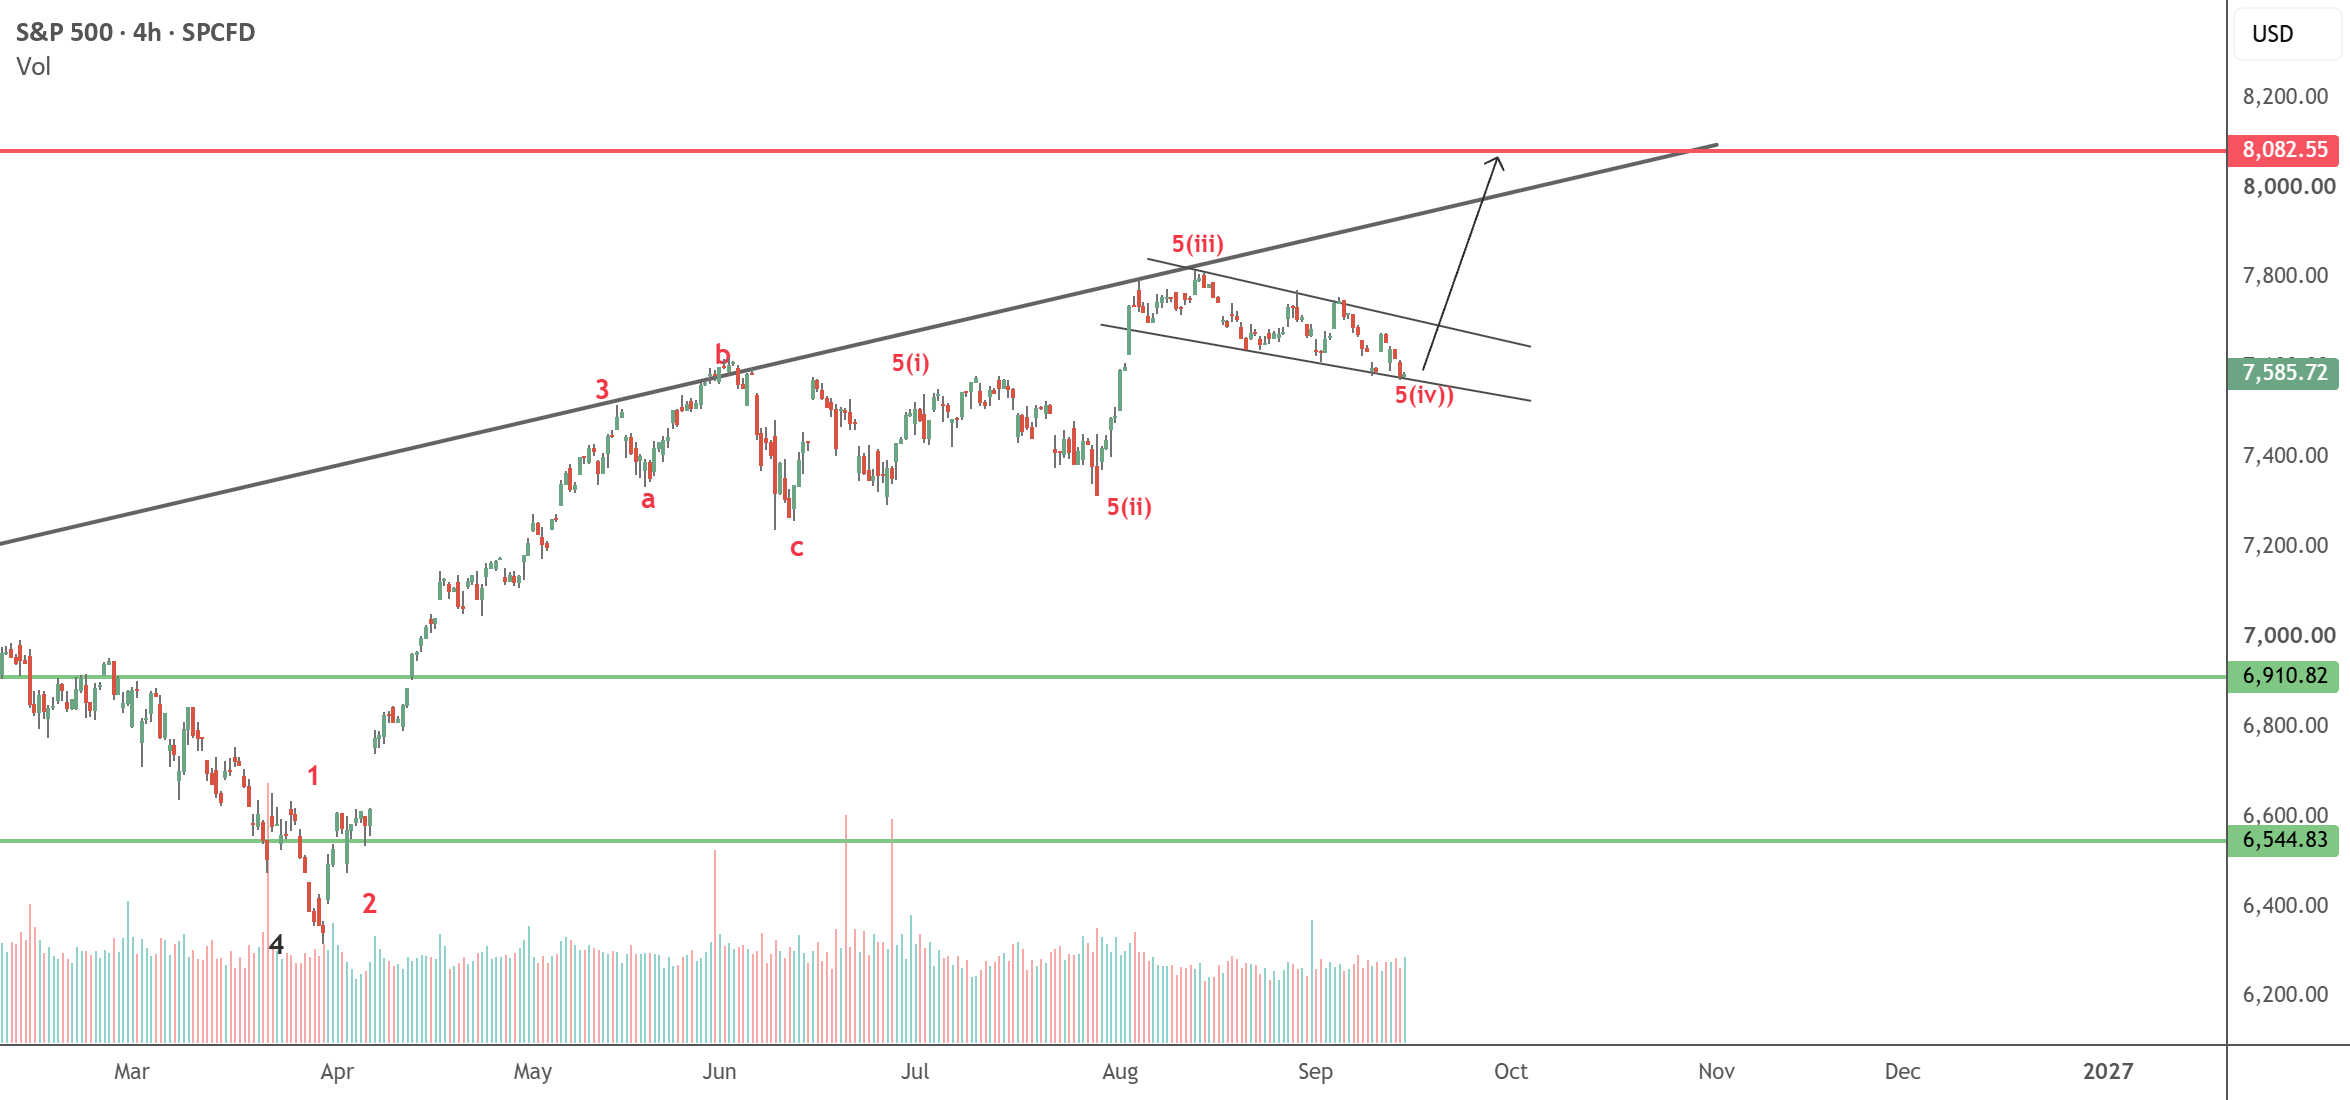
From an Elliott wave perspective, one more upward leg is pending toward the 8050 to 8100 mark, with the setup indicating a fast move higher.
Key support level holds firm
The index has not closed below 7570, an important level that would signal a true breakdown. This support holding is bullish for further upside.
Trade setup with defined risk
A long position from current levels to 8050 offers attractive risk-reward, with a stop loss at 7520 on daily close to limit downside exposure.
The short version
Despite widespread expectations for a rate hike and market correction, chart patterns suggest the S&P 500 has one more leg up to around 8050-8100 before any sustained pullback.