From TradingView · · 1m 10s
S&P 500 Hits Channel Resistance
S&P 500 tests resistance near ATH as sharp sell-off looms.
In brief
S&P 500 tests resistance near ATH as sharp sell-off looms. S&P 500 breaks below $7,708 after testing resistance, moving toward $7,624-$7,523 support zone. Originally reported by TradingView.
S&P 500 near All-Time Highs
The S&P 500 index is trading near its All-Time Highs at $7,825.
Resistance tested on 4-hour chart
The index reacted negatively to the upper boundary of the Ascending Channel and the major Potential Reversal Zone at $7,793-$7,760.
Bearish technical signals

A rejection from the Ascending Channel and PRZ increases the possibility of a break below $7,708.
Elliott Wave correction
The S&P 500 appears to have completed a Zigzag Correction(A-B-C) from an Elliott Wave perspective.
Bullish counter-signal
A Bullish Gartley Harmonic Pattern is visible on the 4-hour chart providing a counter-signal to the bearish outlook.
Trade setup details
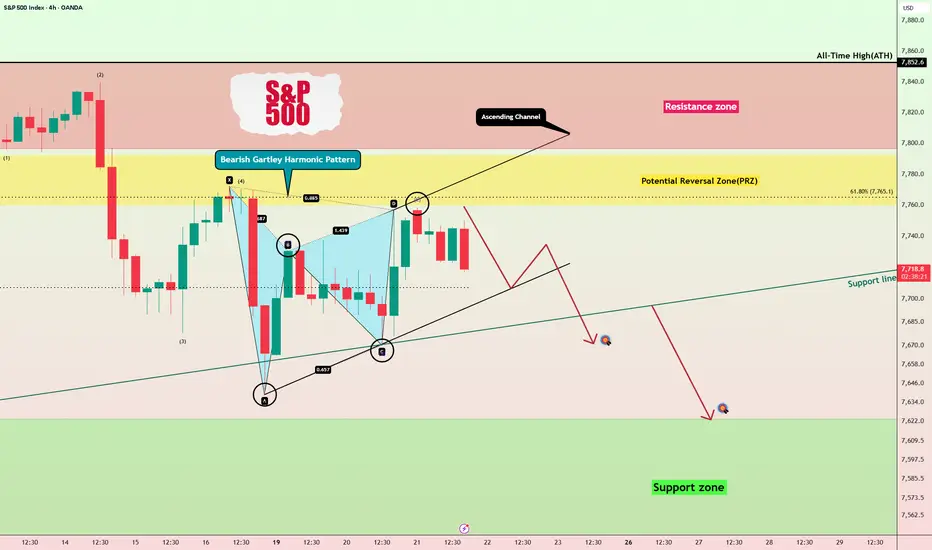
First take profit at $7,666, second take profit at $7,629, stop loss at $7,801 with key trading level at $7,708.
Market reaction
The S&P 500 broke below $7,708 and reached the support zone of $7,523-$7,624 as markets enter final trading day of the week.
The main idea
S&P 500 breaks below $7,708 after testing resistance, moving toward $7,624-$7,523 support zone.