From TradingView · · 1m
SPY chart shows bearish divergence, buying opportunity ahead
A technical analyst spots warning signs in the S&P 500 ETF but sees a generational buying opportunity coming in the 2020s.
In brief
A technical analyst spots warning signs in the S&P 500 ETF but sees a generational buying opportunity coming in the 2020s. Despite short-term bearish signals, this could set up the last major buying opportunity of the decade. Originally reported by TradingView.
A chart worth remembering
The SPY 3-week chart shows a pattern that traders will reference for months and years to come.
“We'll be talking about this chart for months and years to go into the future.”
Clear bearish divergence spotted
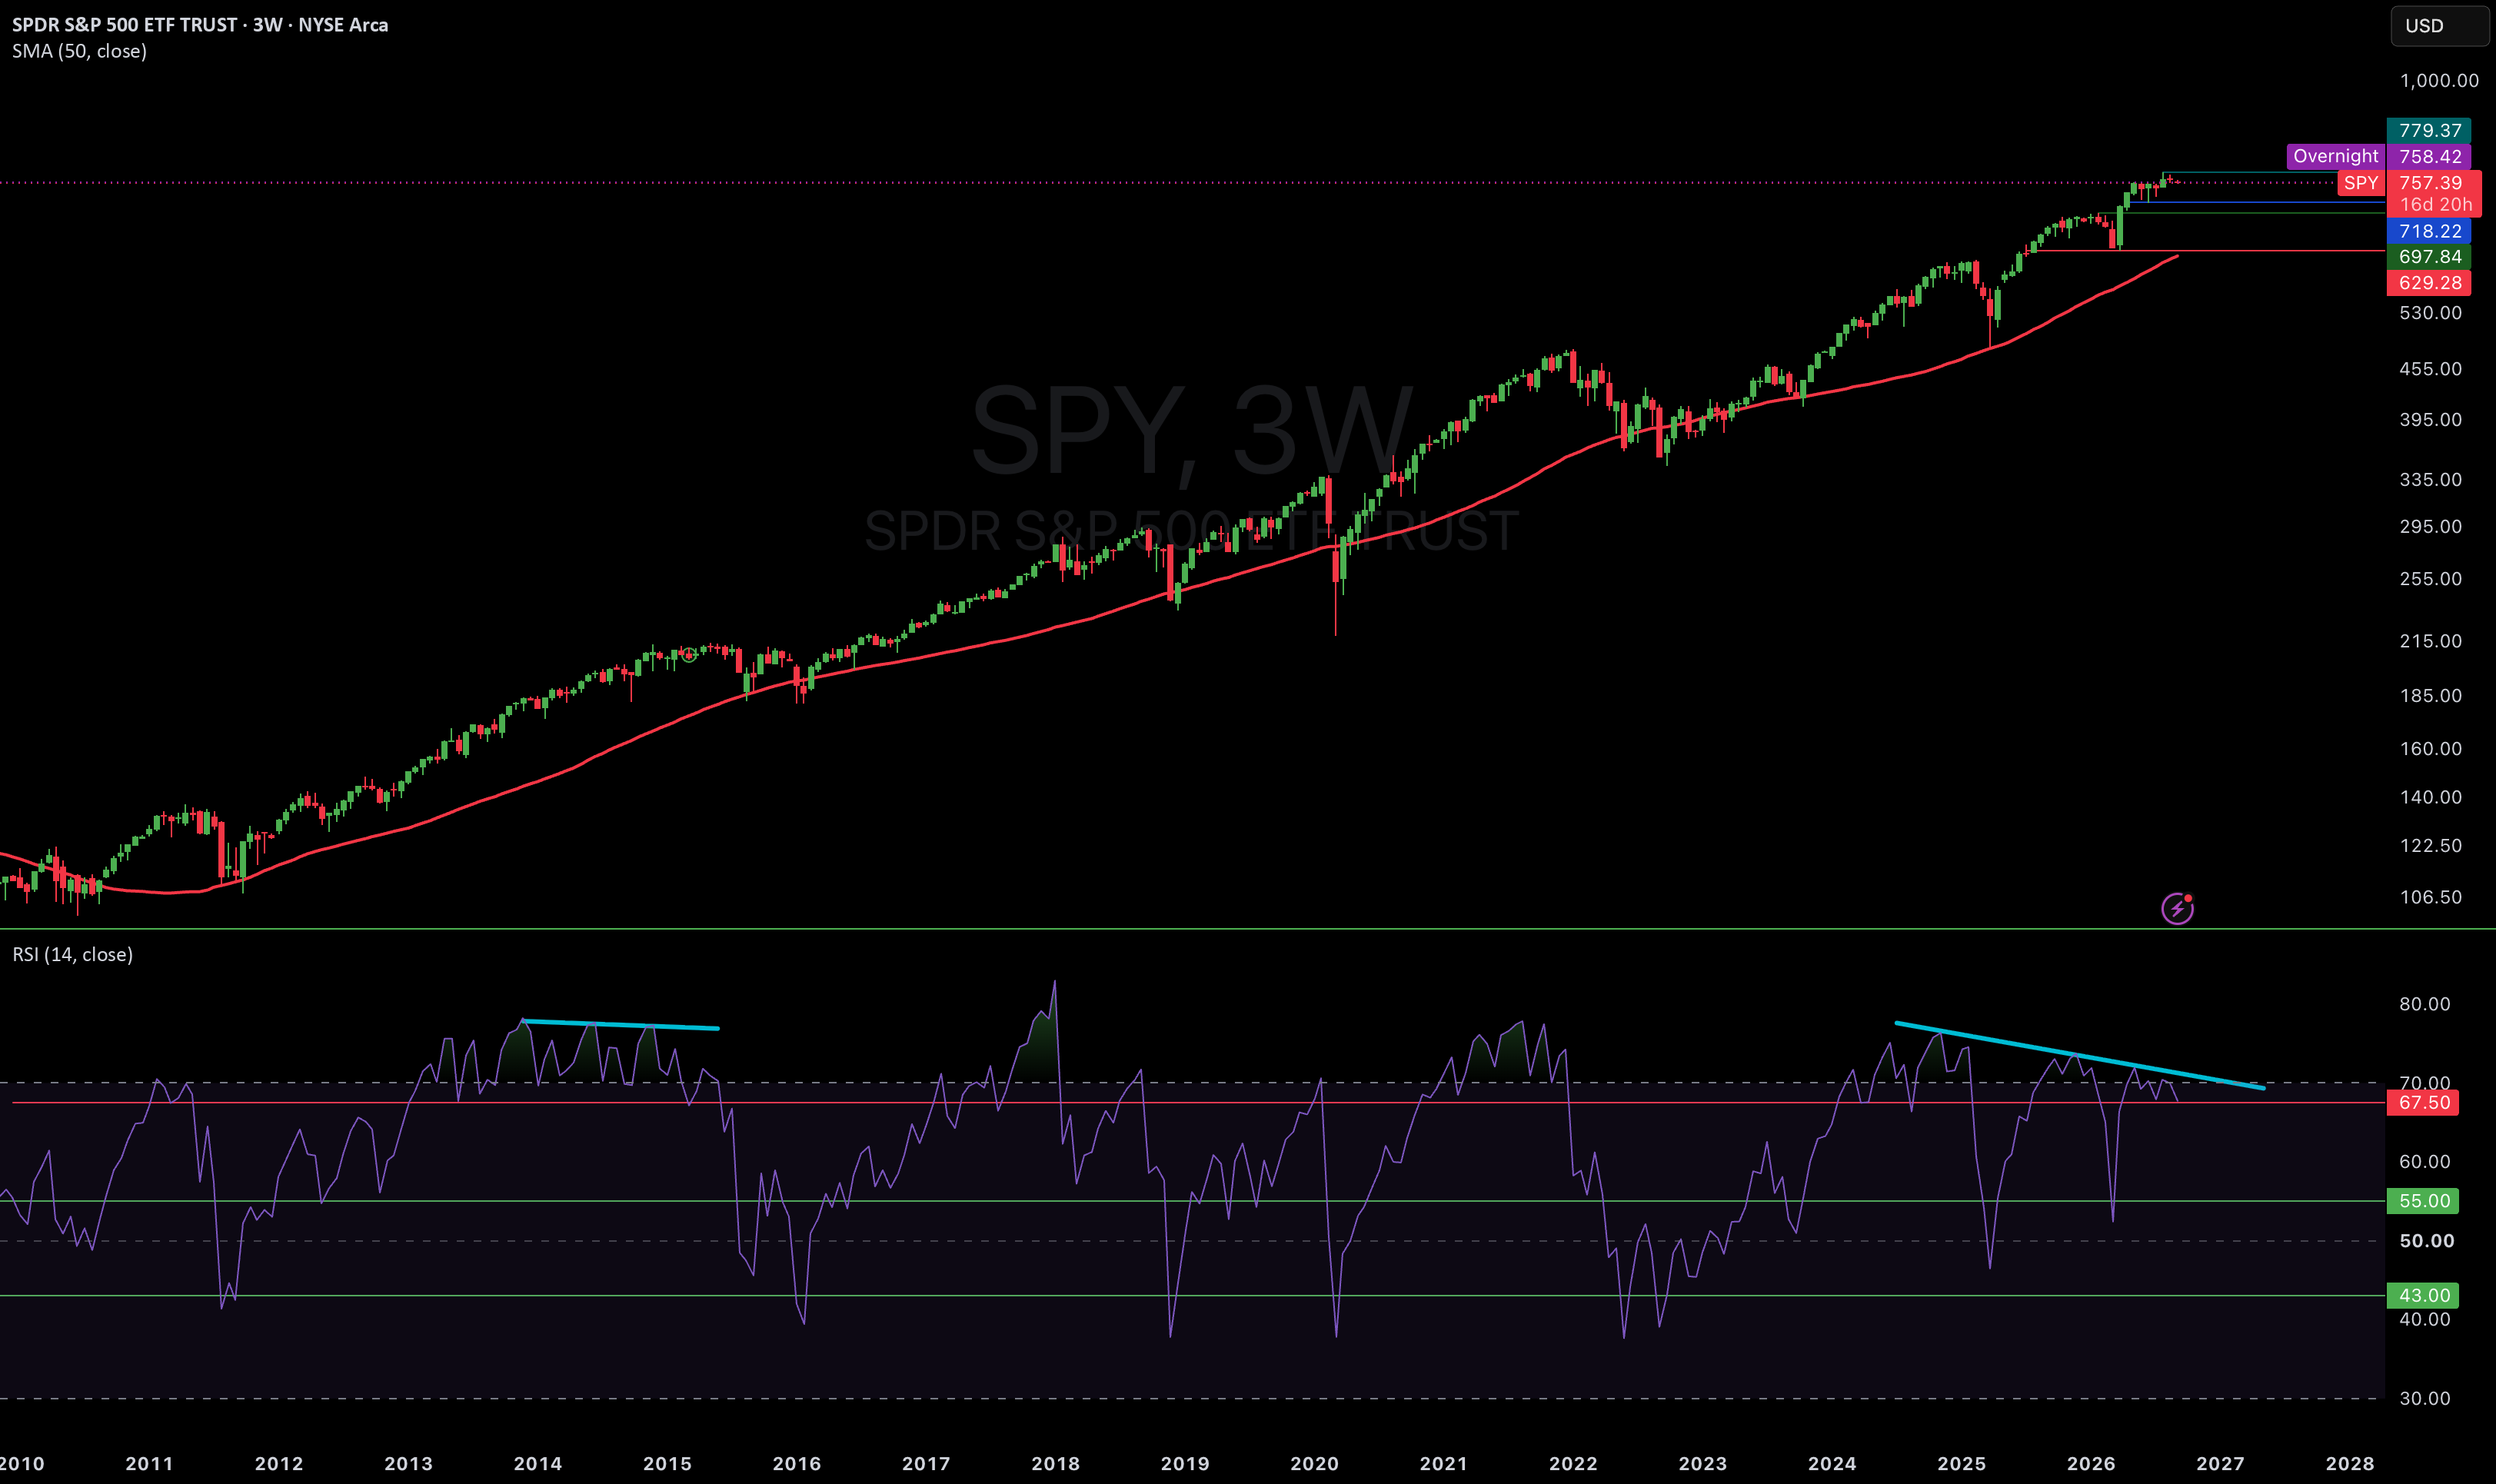
Technical indicators on the S&P 500 ETF are showing bearish divergence, a warning sign that often precedes market weakness.
“Clear bearish divergence in play”
Not bullish short term
The analyst is avoiding a bullish stance on stocks in the near term based on current technical signals.
“I am not bullish on stocks here for the short term”
Last generational buying opportunity
Despite the bearish setup, this could create the final major buying opportunity of the 2020s decade.
“this will be the last generation buying opportunity of the 2020s!”
Not financial advice

TradingView emphasizes this analysis doesn't constitute financial, investment, or trading advice.
The essence
Despite short-term bearish signals, this could set up the last major buying opportunity of the decade.