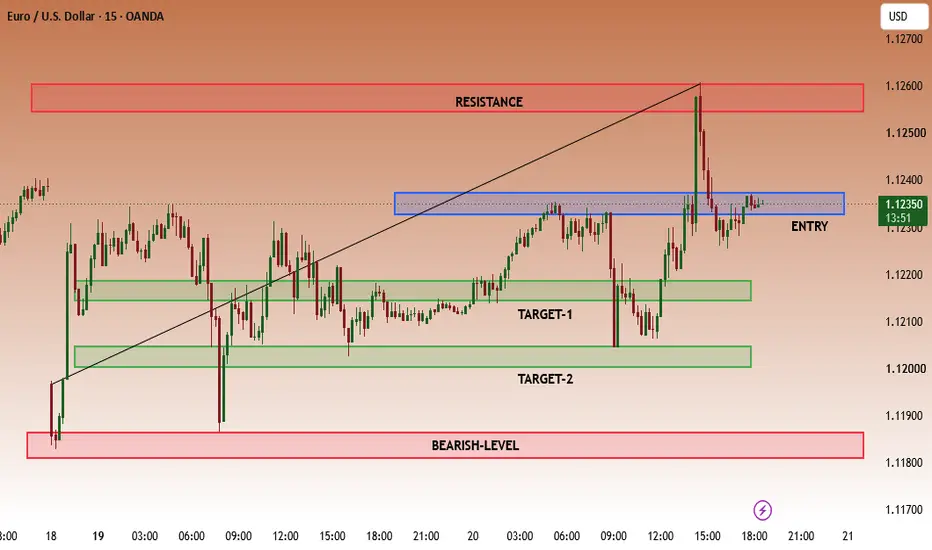
From TradingView · · 30s
M30 Gold USD Chart Analysis
Gold price analysis shows potential liquidity trap before weekly key level.
In brief
Gold price analysis shows potential liquidity trap before weekly key level. Gold price may drop to liquidity zone before bullish structure forms. Originally reported by TradingView.
Gold Price Analysis
Gold price analysis shows potential liquidity trap before weekly key level.
Liquidity Strategy
Gold is building liquidity before tapping into weekly key level, expected to drop towards liquidity before bullish structure forms.
TradingView Chart

M30 Gold USD chart by samink596 shows 137 views and liquidity patterns.
The headline
Gold price may drop to liquidity zone before bullish structure forms.